1. Project Title and Description
Explore and analyse HR data to answer questions from Top Management. The final outputs include visualisations and insights into these questions.
2. Problem
There are five questions:
1. What is the correlation between an employee's performance rating and their salary, age, or job level?
2. Is there a difference in employee satisfaction levels between different departments in the company?
3. How does an employee's job level relate to their likelihood to leave the company?
4. How does the length of time an employee has been with the company impact their salary and performance rating?
5. What is the most common reason for employee attrition, and is there a pattern to when employees leave the company (e.g. by age, tenure, or performance rating)?
3. Data
This dataset contains a table in CSV format with 311 records, one for each employee and their attributes (Name, Gender, Salary, DOB, Job title, Date hired, Date terminated, Location, Manager, Performance Score, Employee satisfaction,...)
Data cleaning:
Change to Local date format (originally in U.S) for DOB, date of hire, date of termination, last performance review date.
Change the data type of number columns appropriately. Most of them were initially identified as text.
Clean the Dept ID column to match the Department column: Admin-1; Executive-2; IT/IS-3; Software Engineering-4; Production-5; Sales-6.
Trim the Position column to remove leading and trailing blanks.
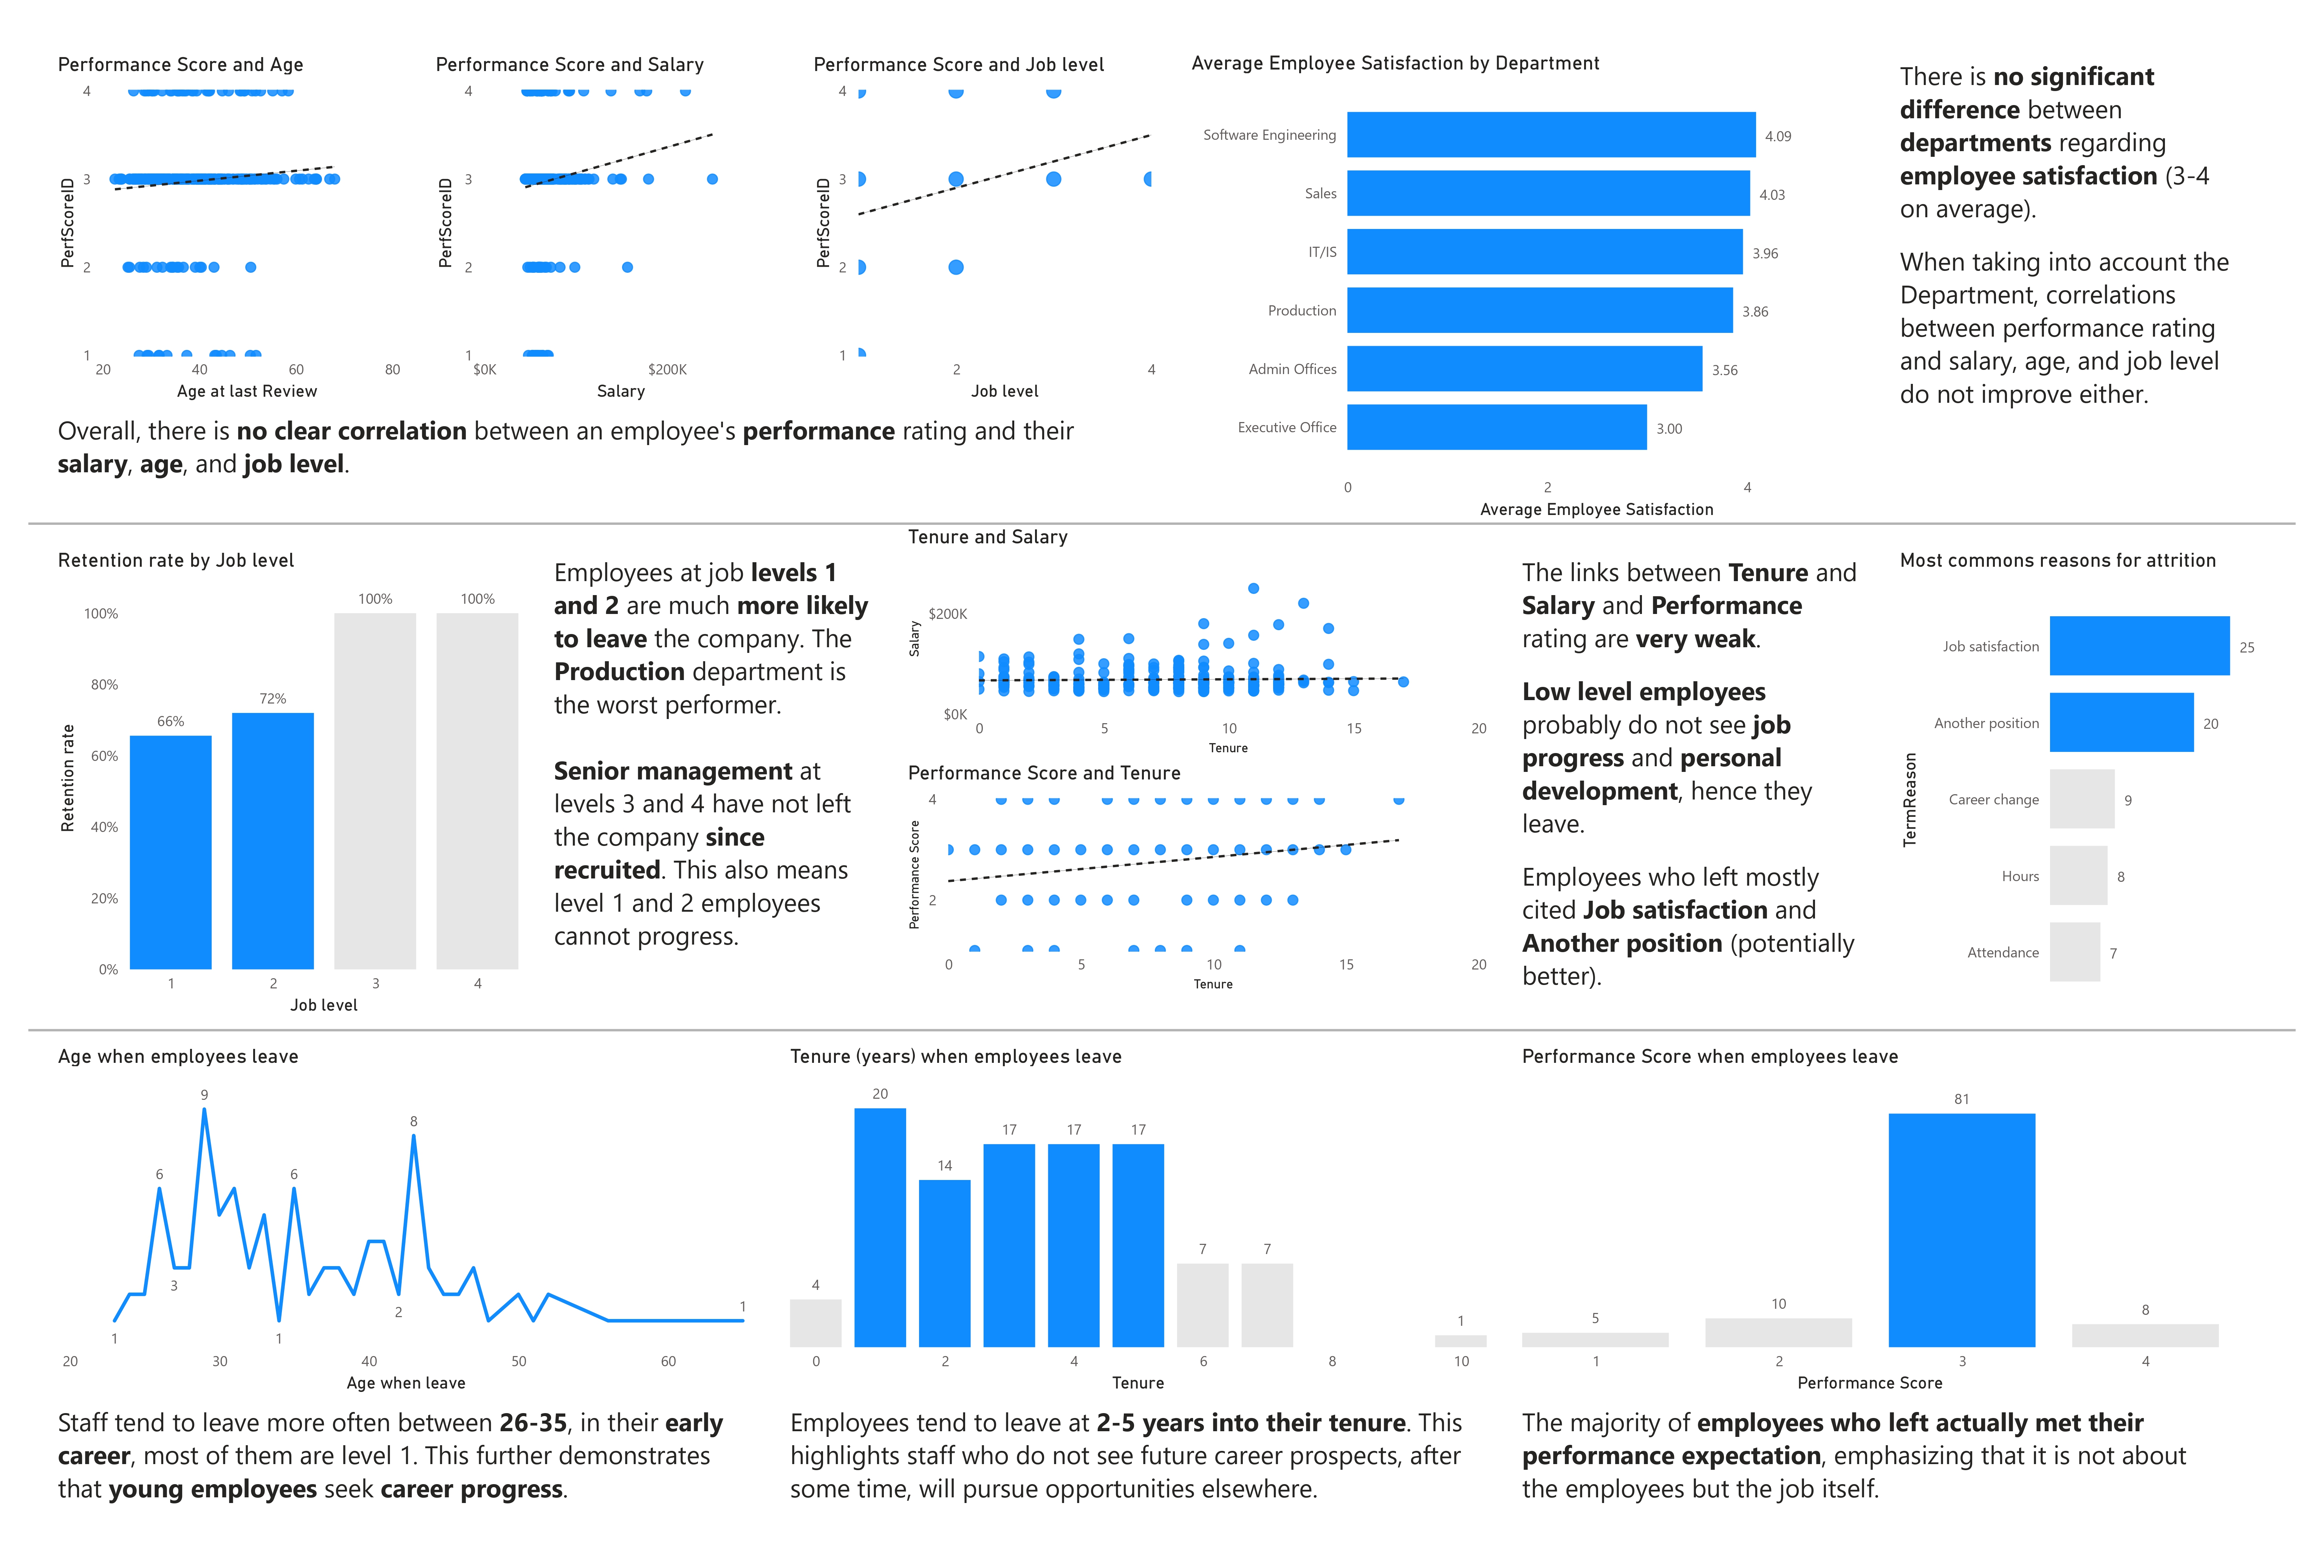
4. Result 1. What is the correlation between an employee's performance rating and their salary, age, or job level?
Use scatter plots to show the correlation between variables.
Extract the data to Excel tables and calculate correlation (CORREL) to verify the strength of the relationships.
To obtain the Job level, each Job title is assigned a level based on the number of reporting chains below them. Staff without a direct report is at Job level 1. Examples:
CEO (4) => Shared Services Manager (2) => Accountant (1)
>>> Overall, there is no clear correlation between an employee's performance rating and their salary, age, and job level.
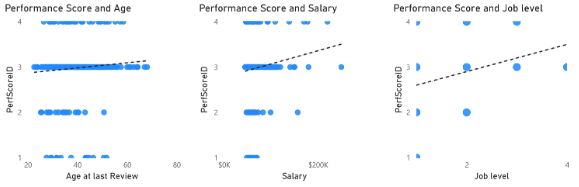
2. Is there a difference in employee satisfaction levels between different departments in the company?
Use a horizontal bar chart for visualisation. Perform an ANOVA test (Analysis of Variance) to verify if there is significant difference between the Departments.
>>> There is no significant difference between departments regarding employee satisfaction (3-4 on average).
>>> When taking into account the Department, correlations between performance rating and salary, age, and job level do not improve either.
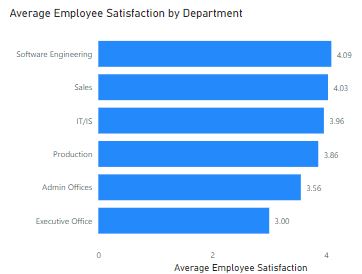
3. How does an employee's job level relate to their likelihood to leave the company?
Use a vertical bar chart for visualisation. For the y-axis, create a measure for the retention rate (number of employees who left over the number of all employees).
>>> Employees at job levels 1 and 2 are much more likely to leave the company. The Production department is the worst performer (lowest retention rate)
>>> Senior management at levels 3 and 4 have not left the company since recruited. This also means level 1 and 2 employees cannot progress.
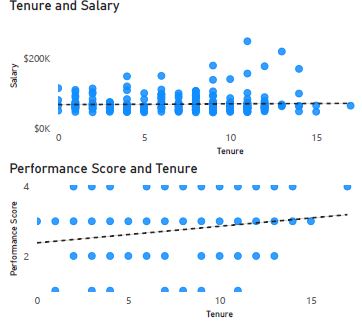
4. How does the length of time an employee has been with the company impact their salary and performance rating?
Once again, scatter plots are used for illustration. In this case, it is not necessary to calculate correlation because the trend lines are flat in both graphs.
Tenure is calculated as a column for the period between Date of Hire and Date of Termination. If the employee is still employed, the Tenure if from Date of Hire to now.
>>> The links between Tenure and Salary and Performance rating are very weak.
>>> Low level employees probably do not see job progress and personal development, hence they leave.
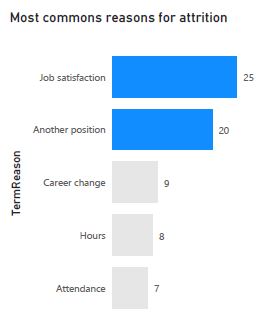
5. What is the most common reason for employee attrition, and is there a pattern to when employees leave the company (e.g. by age, tenure, or performance rating)?
The TermReason column is cleaned and properly formatted. Some reasons are grouped together like more money and unhappy as they link to job satisfaction.
>>> Employees who left mostly cited Job satisfaction and Another position (potentially better). This ties back to the tenure graphs above. Employees at low level will leave for better positions.
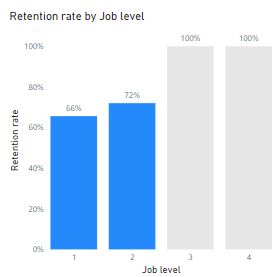
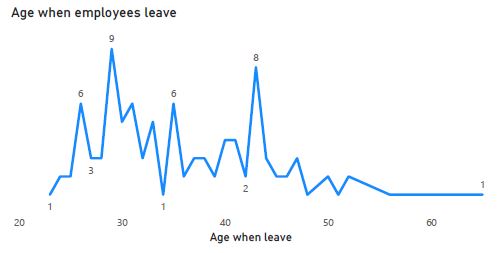
Age is the difference between now and DOB, visualied on a line chart, filtering for employees who have left.
>>> Staff tend to leave more often between 26-35, in their early career, most of them are level 1. This further demonstrates that young employees seek career progress.
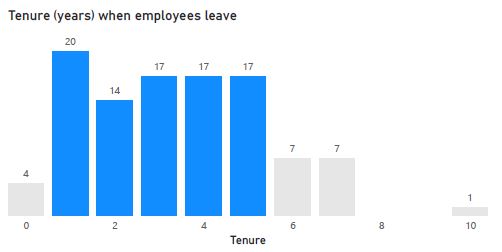
Tenure is plotted on a bart chart against the number of employees who have left.
>>> Employees tend to leave at 2-5 years into their tenure. This highlights staff who do not see future career prospects, after some time, will pursue opportunities elsewhere.
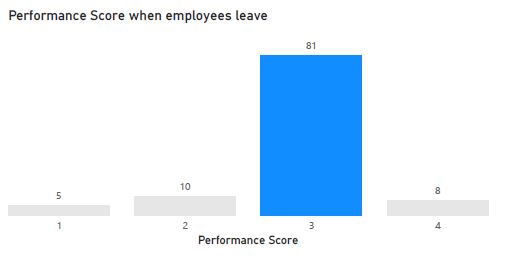
Use a vertical bar chart for visualisation.
>>> The majority of employees who left actually met their performance expectation, emphasizing that it is not about the employees but the job itself.
5. Technical Details
This project used entirely Power BI to analyse and visualise the results.